Co-authors: Florian Grigoleit, Jan Neumann-Mahlkau
Abstract
We present a template for gathering and structuring all information required by a human or software to perform a failure-mode-and-effects analysis (FMEA). Instead of introducing new theoretical concepts, we help practitioners in improving and accelerate their work. Indeed, FMEA is achieved by expert groups to predict whether failures in a system can cause relevant effects on the behavior of a system. For this task three types of information are required: the knowledge of the considered system behavior, the relevant failure modes, and the effects of interest that are derived from the system requirements. Usually, the component failure modes and system effects are described using natural language or semi-formal expressions which are imprecise by nature and often interpreted differently by different experts. Consequently, such a way to proceed can lead to erroneous or hardly exploitable analysis conclusions. To tackle these issues, we propose a template for safety analysis. This template contains the needed information (description of the system behavior, component failure modes, and tracked effects) described using formal languages. The use of a formal knowledge representation makes the results of the FMEA independent from the analysis authors and thus repeatable. Besides this, the template also supports formalizing and documenting the assumptions and hypotheses made to reach the conclusions of an FMEA. The practical use of such a template for safety analysis is highlighted through the safety analysis (single point of failure) of a voltage monitor presented in the “ARP4761 recommended practice for aerospace system safety assessment”. The analysis of the voltage monitor is performed automatically by a program that uses the information contained in the template. The FMEA results of the ARP4761 and those obtained using the template are then compared. The interest in the proposed template for automated safety analysis is discussed and further work to be achieved on the template is concluded. 1. Introduction
Failure-mode-and-effects analysis (FMEA) is a well-established process [1] for validating designs that is mandatory in aeronautics [2]. The core idea of an FMEA is to consider the potential failures of a system and predict their impact on the system to assess whether it leads to undesirable effects or not.
Although the principle of this analysis is simple, in practice, the FMEA is a repetitive, laborious, and time-consuming task [3] requiring manual work by expert groups. When performed, the experts usually represent the system’s behavior, failures, and tracked effects in natural language or semi-formal specifications [4], which are imprecise by nature and can be interpreted differently by other experts.
In this paper, a template for safety analysis is proposed to reduce the above-cited imprecision that can lead to errors in the generation or understanding of FMEA results. This template does not introduce new theoretical concepts but contains all the information required to achieve an FMEA in a formalized way.
Relying on formalized information reduces the risk of imprecision or misunderstanding for both authors and reviewers of the analysis. The template is targeting the generation of FMEA results that are unique and repeatable. In practice, the inevitability of human errors renders such a quality level only reachable using algorithms for automated safety analysis. The proposed template has therefore been developed with the intent of being used by such algorithms. Additionally, the template aims at documenting the FMEA results as well as summarizing all its assumptions in a concise and precise manner.
Whereas scientific literature proposes advanced FMEA techniques, considering for instance distinctions between transient and persistent failure modes [5] or sequenced combinations of failure modes [6], the FMEA targeted by the template are simpler but still correspond to industrial needs. More precisely, the template allows the generation of single-point-of-failure (SPOF) FMEA where failures are considered persistent, and the system behavior is deterministic. In addition to this, considering automated safety analysis, the safety analysis of an industrial project can be re-evaluated and refined using the same template after an upgrade of the FMEA automation algorithm.
The single point of failure FMEA, for which the template has been designed, is achieved in three steps: generation of failure models via the injection of failure modes into a failure-free model of the system; evaluation of the models with failure using predefined input combination; detection of effects based on system simulation results.
In this paper, the source and document from which information can be taken to feed a template are first presented in section 2. The structure of the proposed template is then introduced in section 3 with a description of the contained information and for each information type, a formalization strategy. The construction and use of the template for an FMEA are highlighted in section 4, through the analysis of a use-case (voltage monitor) presented in the ARP4761 guideline for aerospace system safety assessment [7]. The single point of failure safety analysis of the voltage monitor is achieved using the built template and an automated safety analysis tool [8] developed by the authors of this paper. The results of the safety analysis presented in the APR4761 and established using the template are compared and discussed. Perspectives and future work on the presented safety analysis template are eventually concluded and presented in section 5.
2. Sources of information
Before a template is built, let us first discuss where the information it requires can be taken from. The development of the template has been made with the aim to reuse a maximum of information available from its design phase.
2.1. System behavior
System models developed in the design phases contain precious information about the system’s behavior and structure and should be included in the template. In a general way, the model attached to the template should be chosen with regard to the method used for the safety analysis assessment. In this paper, the FMEA was achieved based on the use of a numeric, deterministic, and simulatable model. Users aiming to use the HiPHOPS [9] safety tools for instance can use models representing the system topology. The language in which the system is modeled can also be selected with regard to the capabilities of the existing compatible simulation or safety tools, one can cite for instance [10] and [11].
2.2. Failure modes
Failure modes and rates of the components are indicated in sources (e.g. SN 29500, IEC 61709, etc.) but might also be communicated by components’ manufacturers, or established based on the designer’s experience.
2.3. Effects
System requirements can be used to define functional (from functional requirements) and safety-critical effects (from safety requirements). Requirements are also used to identify the operating range and condition of the system, for instance: the voltage range of an input, the system environment temperature, etc.
Bills of materials and datasheets contain information that allows defining effects on the component’s operating conditions and detect, for instance, potential overstress (i.e. exceed of maximal ratings) or undesired setup change. For instance, integrated circuit (IC) operation mode can be set by connecting specific components to its pins, a modification (induced by a failure mode) of this setup can therefore result in an undesired behavior of the IC.
3. Structure and content
The template aims at containing all the information needed for the achievement of an FMEA. In the present work, this information on a studied system has been categorized into three distinct groups: the system behavior; the considered failure modes and rates stored in a library; the tracked effects.
In this section, the information contained in the template is presented, and the method and tool for the formalization of this information are left free to the reader. The implementation of the template used for the analysis of the voltage monitor is presented as an instance in section 4.
3.1. System behavior description
Before the impact of a failure mode on a system can be determined, the behavior of the nominal system is to be defined as well as the conditions under which it is studied.
Common approaches to automatic or semi-automatic FMEA face the problem of creating appropriate models [12]. In the present work, avoiding the development of purpose-built models for FMEA is a key priority and we encourage the reuse of behavior models built in the design phase.
The formalization of the system behavior removes uncertainties about how the nominal system reacts and how a failure mode can affect it. The formalization strategy chosen in this work is to rely on a deterministic and simulatable model of the system build in the appropriate simulation environment.
The variables on which the system environment may influence the system response (user command, surrounding systems interactions, environmental conditions…) are considered as input of the model while the variables used to detect the potential system effects (that are not input) are defined as outputs. The inputs’ combinations under which the system is to be studied as well as their combination need to be explicitly described. Note that a model can have variables of various types that do not always correspond to real numbers (e.g. Boolean, Integer). High-level models, like functional models, can involve non-numeric variables that describe in a qualitative way the quantities shared between components, for instance: “encrypted data” or “enabled signal“.
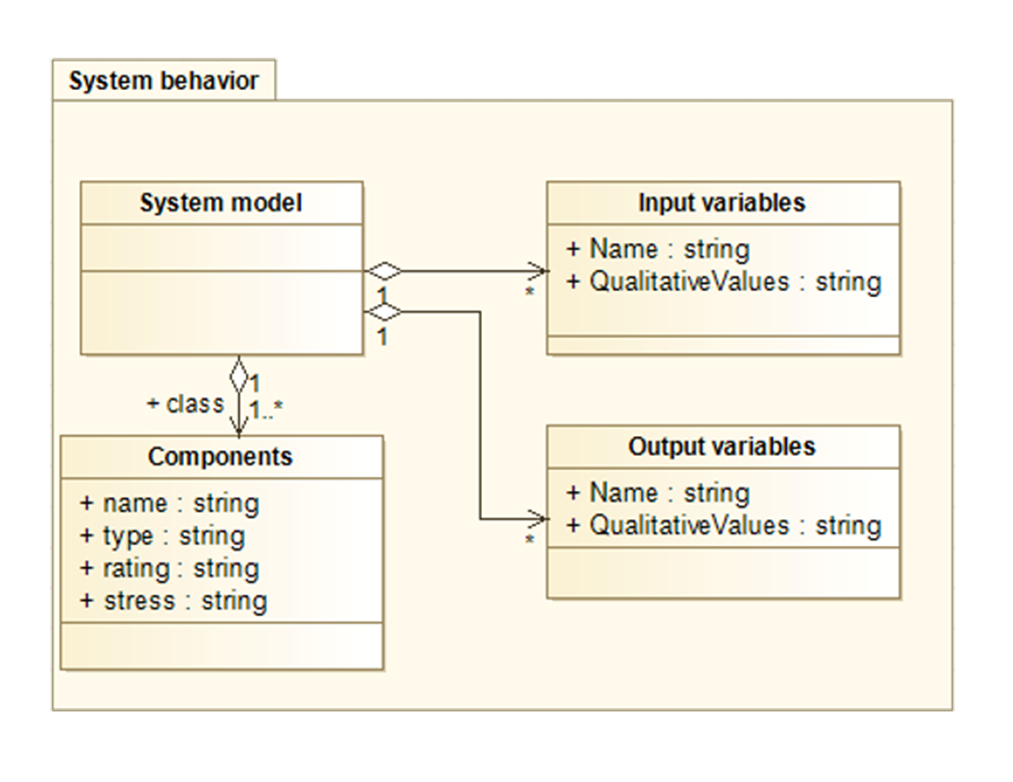
As visible in Figure 1, the input and output variables of the model own qualitative values. Qualitative values correspond to partitions of a variable domain, each qualitative value has a name and one or two landmarks that delimit its partition. Let us consider a voltage u defined in the range [0; +inf], the voltage u is nominal in the range [2; 4] V and overvolted for any value over 4V. One can therefore define 2 qualitative values for the variable “u” (see Figure 2): [2; 4] V nominal voltage; [4; +inf] V overvoltage. In this example, landmarks used for the definition of the qualitative values are: 2V, 4V, and +inf.
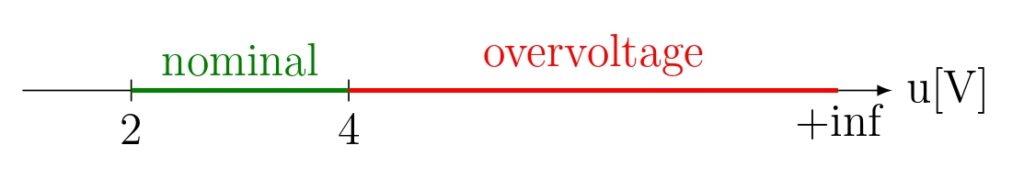
In the frame of this work, qualitative values are used for the detection of effects (see section 3.3). More precisely qualitative values are used in a consideration constraint denoted “EQ(variable, qualitative value)” that returns True when a variable reaches a given qualitative value and False otherwise. For instance “EQ(u, nominal)” returns True if “u” is in the range [2; 4] V and False otherwise.
The names, component types, ratings (e.g., maximum allowed current/tension), and actual stresses can be used to determine the actual failure rates and modes of a given component (see section 4.2). While the ratings of a component are generally available in components manufacturers’ datasheets, the actual stress levels undergone by components can be estimated using the system model and scenario. The simulation of the system model can provide a quick and convenient means for the components’ stresses evaluation.
Optionally, models of the system under failure can be generated from the system’s nominal behavior using failure injection. This operation is detailed in section 3.2.1 and allows the analysis author to later test the impact of failure modes on the behavior of the considered system.
3.2. Failure modes and rates description
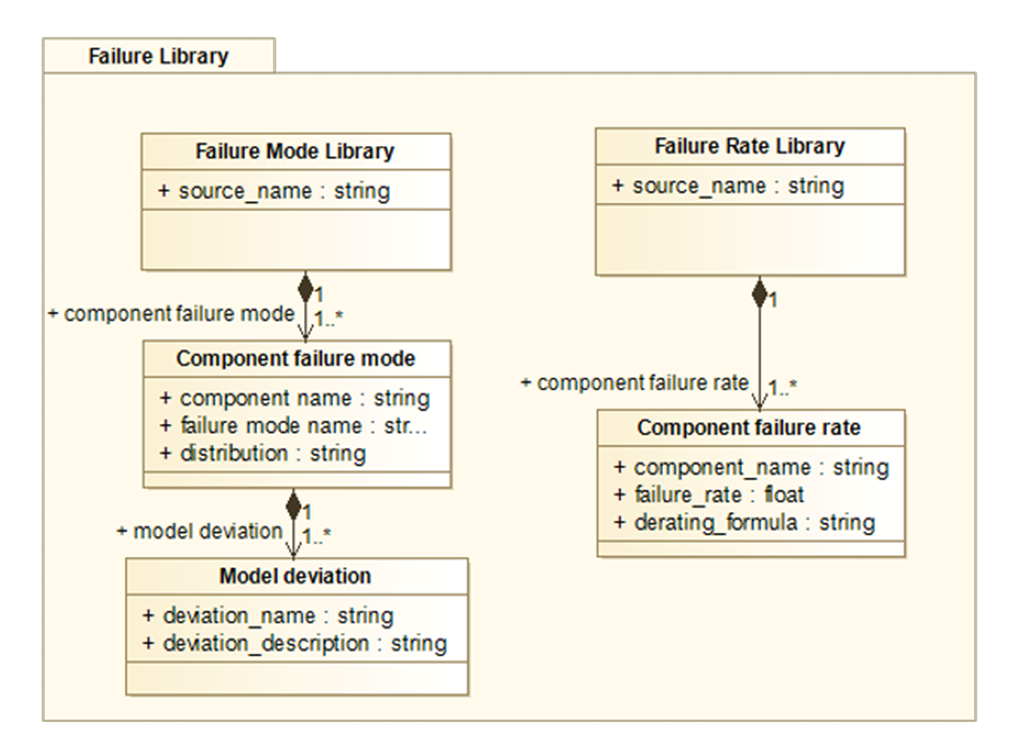
The knowledge of the failure modes and rates of the components of interest is crucial in a safety analysis. This information can be provided in sources or established based on experience with components’ failures. This information is part of the proposed template and is structured following the graph presented in Figure 3.
3.2.1. Failure modes
Failure modes as described for components in sources may be very general and in need of interpretation from the FMEA author as concrete behavior modifications. For instance, the failure mode “Value change” of a capacitor in the IEC 61709 can refer to either a decrease or an increase of the component’s capacitance. Furthermore, the amplitude of the component capacitance drift is also a parameter to determine.
The failure mode interpretation as a set of possible deviations of a component from its nominal behavior is the task of the FMEA author. In the present work, each interpretation of a failure mode is formalized using modifications of the considered component parameters or connectivity. For instance: a shorted electrical dipole is modeled by connecting an ideal (i.e. 0 Ohm resistance) wire in parallel to it; an opened electrical dipole is modeled by disconnecting one of its ends. In the present work, the component deviations are described using template sentences. For instance, shorting a dipole is expressed as:
A “ideal wire“,
is connected in “parallel“.
Such a modification is referred to as component deviation. The application of component deviations in a system model is referred to as the injection of failure modes.
In the frame of HiPHOPS [9], the failure modes of components are described using formal expressions that link the component inputs and outputs. A similar approach is used in the AltaRica [10] modeling language, this time however the failure modes are expressed directly in the component model. This makes the AltaRica language hardly compatible with the proposed template because of information redundancy issues: we want to avoid the failure mode being described both in the failure mode library and in the system model.
Hence, from the system nominal behavior and component deviations, one can generate a set of models, each of them predicting the system behavior when undergoing a single failure mode. These models can help the analysis author to predict the behavior of the system under failure using simulation easily and confidently. The failure injection is in practice a repetitive task, the automation of this task is, therefore, a motivation for the use of sentence-based templates for the description of components’ deviations. Indeed, such a description of a failure mode can be understood by a program for automating the injection of failure modes.
3.2.2. Failure rates
Failure rates are given for different components in sources (e.g. SN 29500). The determination of an actual failure rate is given in such sources as the result of a derating formula. Derating formulas rely on parameters like the component type, ratings, and actual stress, such parameters are stored in the “model behavior” part of the template (see Figure 1).
3.3.3. Effect formalization
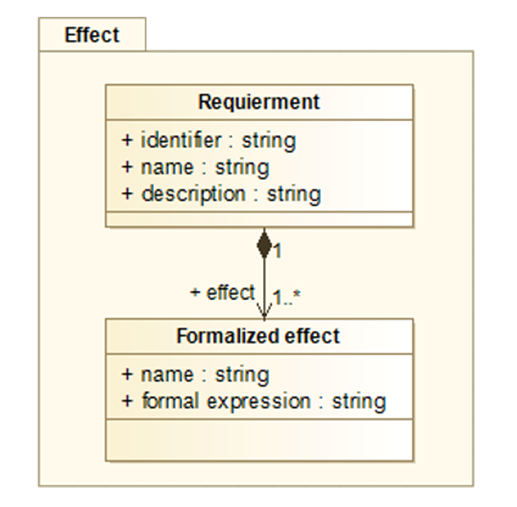
In the present work, we assume that system effects are derived from the system requirements (see Figure 4). The formalization of effects is inspired by [13] and relies on constraint expressions corresponding to relations involving Boolean operators (AND, OR, NOT,…), the EQ test function (see section 3.1), and other functions (e.g. ALWAYS() and EXISTS() see section 4.4). For any considered input set and model under failure, a constraint found to be true means the occurrence of its associated effect. In the application presented in section 4, a constraint-programing (CP) solver has been used for the detection of effect occurrence from effect constraints.
An interesting approach for the effect formalization relies on the use of sentence templates. In [4], such templates were used to generate formalized requirements in the form of equations. The use of such a template with an appropriate formal requirement language (FRL) could help to quickly generate effect expressions with help of an ad-hoc program.
In addition to this, interesting features for the temporal extension of Boolean operation can be found in the work [14] on the development of Pandora. Although Pandora initially intends to describe sequences of failure mode occurrences for Fault Tree Analysis (FTA), the Boolean operator it introduced could be used in the frame of this work to describe effects involving sequences.
4. Application
In this section, the above-described template is built and then applied to automatically generate the FMEA of a voltage monitor given as an example in the ARP4761 aerospace safety assessment guidelines (see Figure 5). The template has been built using an Excel file while the FMEA has been generated automatically using a program we developed [8].
For the sake of illustration, the Excel sheet that has been used for implementing the template is entirely presented in Figure 6, Figure 7, Figure 9, Figure 10, and Figure 11.
The information we started from for building the template of the voltage monitor is: a netlist (SPICE model we built from the system schematics found in the ARP4761, see Figure 5); the list of studied effects (from ARP4761, see Table 1); a list of failure modes to be considered (from the FMEA table in ARP4761).
To allow the FMEA automation software to generate and simulate models of the system under failure, the path to the model presented in Figure 5 and the simulation tool to use were specified in the template as shown in Figure 6.
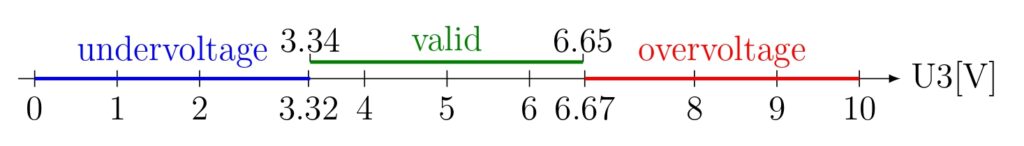
From the system schematics, we established its main function which is: output (“Out”) a logic high (1 V) signal when the input (“U3”) voltage belongs to its valid [3.34; 6.65] V range; output (“Out”) a logical low (0 V) signal otherwise.
Table 1. Effect tracked on the voltage monitor in the ARP4761
| Code | Effect name | Description |
| 1 | Monitor Stuck Valid | The Out signal is stuck high |
| 2 | Nuisance Monitor Trip | The delay of the Out signal decreases; spurious monitor trip |
| 3 | Monitor Stuck Tripped | The Out signal is stuck low |
| 4 | Monitor Sensitivity Shifts | The monitoring windows changes |
From the FMEA sheet of the voltage monitor presented in the ARP4761, we extracted the system failure mode for each component.
4.1. System behavior and scenarios definition
The behavior of the voltage monitor has been formalized using the SPICE netlist resulting from its modeling. The path to the model location is indicated in the template.
More precisely, the system has been modeled under LTspice [15], a free-to-use software SPICE with a graphical interface for the creation and simulation of electronic systems. SPICE relies on the use of netlists for the representation of electrical circuits. A netlist contains the definition of components with their: names, connected nodes, and parameters. As an instance, the definition of the R1 resistor of the system nominal model is written as:
R1 N002 N005 1000 The above netlist definition indicates that the R1 resistor that has a 1000 Ohm impedance is connected to the nodes “N002” and “N005”.
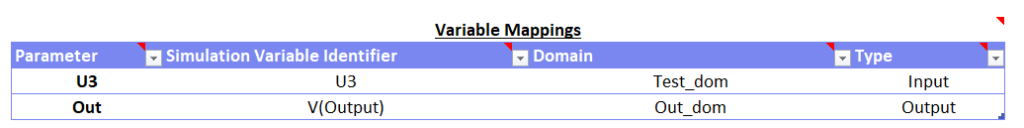
In this study, the two variables of interest are “U3”: the tested voltage and “Out”: the logical signal indicating whether the tested voltage belongs to its valid range or not. These two variables are then entered in the template SPICE identifier and domain (see Table 2, Figure 7, and Figure 9). The “Domains” of each variable correspond to the partitioning of its domain using qualitative values.
Table 2. Model variable mapping
| Variable name | SPICE identifier | Domain |
| U3 | U3 | U3_dom |
| Out | V(Output) | Output_dom |
The considered scenarios are, therefore: “U3” belongs to its valid range; “U3” is out of its valid range. From the knowledge of the system’s main function, we can define qualitative values for the “U3” and “Out” voltage signals, see Table 3.
Table 3. Voltage monitor’s qualitative values names and definitions
| System Variable | Qualitative value Definition | Name |
| U3 | [0; 3.32] V | Undervoltage |
| U3 | [3.34; 6.65] V | Valid |
| U3 | [6.67; 10[ V | Overvoltage |
| Out | 0 V | Tripped |
| Out | 1 V | Valid |
The sets of qualitative values used for partitioning the domain of each variable are indicated in the template. The template we build used the qualitative values presented in Table 3. The evaluation of the system by the automated safety analysis has been achieved for the landmarks presented in Table 3 as well as additional landmarks (1V, 2V, 8V, and 9V) as depicted in Figure 8.
A possible implementation of the qualitative values is given in Figure 9 through the template that has been used for the present case study. The partitioned domains “Test_dom” and “Out_dom” have been previously associated with the variables “U3” and “Out” in Figure 7.
4.2. Failure modes and rates formalization
In this analysis, the considered failure modes are the ones presented in the ARP4761 FMEA of the voltage monitor. For the sake of concision, only the resistor failure modes are described in the “Interpretation” column of Table 4.
The decrease and increase of a resistor or capacitor value have been interpreted as respectively dividing and multiplying by 2 the nominal value of a component (see Table 4). This choice made by the author of the present paper corresponds to common practices but could be discussed. In addition to this, one could also decide to interpret the “Value change” failure mode using different or multiple increases or decreases values.
Once established, the component modification associated with each failure mode interpretation has been described as sentence templates (see Table 4). These specific templates have been understood and used by a specific automated safety analysis software to inject the failure of the system.
Table 4. Failure modes used for the safety analysis of the voltage monitor with their interpretations as component modifications using sentence templates.
| Component | Fehlermodus | Interpretation as component modification |
| Resistor | Opened | The node “1” of the component is reconnected to “new floating node“ |
| Resistor | Value change | The parameter “resistance” is set to “initial_value*0.5“ |
| Resistor | Value change | The parameter “resistance” is set to “initial_value*2“ |
From the system nominal behavior and failure mode interpretation descriptions the software generated a set of models under failure (a netlist file for each component and failure mode interpretations). Instances of the netlist modification induced by the automated injection of failure mode are presented for the R1 resistor in Table 5. Note that “MW_1” is a node generated by the safety analysis software to implement the failure mode.
Table 5. Modifications induced by failure injection on the R1 resistor model definition in the system’s model (netlist)
| Fehlermodus | R1 definition |
| No failure | R1 N002 N005 1000 |
| Opened | R1 MW_1 N005 1000 |
| Value change (decrease by 50%) | R1 N002 N005 500 |
| Value change (increase by 100%) | R1 N002 N005 2000 |
From the system nominal behavior and failure mode interpretation descriptions the software generated a set of models under failure (a netlist file for each component and failure mode interpretations). Instances of the netlist modification induced by the automated injection of failure mode are presented for the R1 resistor in Table 5. Note that “MW_1” is a node generated by the safety analysis software to implement the failure mode.
4.3. Evaluation of the system under failure
The knowledge of the system behavior under failure and input to consider allows us now to evaluate these behaviors. Theoretically, the evaluation of these behaviors should be done for all possible combinations of inputs. In the present case, the system only had a single input (“2U3”), the numerical values considered for this input were taken as the landmarks presented in Figure 8. Proceeding so, we assume that the system output variable is (“Out”) monotonic over the range described by each of the qualitative values we defined for “U3”, this abstraction of the model, advantages, and drawbacks are detailed in [12]. For the sake of simplicity, these inputs are taken as constant during the whole simulated time. For each simulation, the initial, final, minimum and maximum output values (“Out”) obtained are saved and associated with their corresponding qualitative value (i.e. “Tripped” or “Valid”, see Table 3).
4.4. System effects definition and detection
The only requirement of the system is to ensure its monitoring function of “U3” in the range [3.34; 6.65] V. Failing to meet this requirement can occur in various ways, the effects tracked in our FMEA are taken from the ARP4761 and presented in Table 1.
The formalization of the effects of the voltage monitor relies on the use of 2 additional operators: ALWAYS() and EXISTS(). The ALWAYS() operator returns True if the expression it contains is always True and False otherwise. The EXISTS() operator returns True if the expression it contains is found to be True at least once. From this operator we can now propose formal expressions of the effects presented in Table 1, the effects in the template are displayed in Figure 11.
To simplify the expression of the effect, aliases are used (see Figure 10):
- $_valid is the alias for EQ(U3, “Valid”) (i.e. U3 is “Valid”)
- $_undervoltage is the alias for LT(U3, “Valid”) (i.e. U3 is lower than “Valid”)
- $_overvoltage is the alias for GT(U3, “Valid”) (i.e. U3 is greater than “Valid”)
4.4.1. Effect 1: Monitor Stuck Valid
The effect “Monitor Stuck Valid” occurs when the monitor output is always “Valid”, it is then expressed as:
ALWAYS(EQ(Out, Valid)) 4.4.2. Effect 2: Nuisance Monitor Trip
The effect “Nuisance Monitor Trip” occurs when the monitor output is “Tripped” although it should not. For instance, it is detected in the ARP4761 when the system reacts too quickly (loss of delay). For the sake of simplicity, this effect has not been presented here.
4.4.3. Effect 3: Monitor Stuck Tripped
The effect “Monitor Stuck Tripped” occurs when the monitor output is always “Tripped”, it is then expressed as:
ALWAYS(EQ(Out, Tripped)) 4.4.4. Effect 4: Monitor Sensitivity Shifts
The effect “Monitor Sensitivity Shifts” is detected when the limits of the monitored interval [3.34; 6.65] V change. In practice, this can lead to:
- Trip window shifts up: the output is found to be “Tripped” for some “Valid” input and “Valid” for some undervolted input:
AND(

  EXISTS(AND(EQ(Out,'Valid'), $_undervoltage)),
  EXISTS(AND(EQ(Out, 'Tripped), $_valid))

)- Trip window shifts down: the output is found to be “Tripped” for some “Valid” input and “Valid” for some overvolted input:
AND(

  EXISTS(AND(EQ(Out, 'Valid'), $_overvoltage)),
  EXISTS(AND(EQ(Out, 'Tripped'), $_valid))

)- Trip window tightens: the output is found to be “Tripped” for all non-valid input and some “Valid” input. However, the output is not stuck “Tripped” and can be “Valid”:
AND(

  AND($_undervoltage, EQ(Out, 'Valid')),
  AND($_overvoltage, EQ(Out, 'Valid')),
  EXISTS($_valid), EQ(Out, 'Tripped')

)- Trip window widens: the output is “Valid” for all “Valid”, some undervolted and, some overvolted input. However, the output is not stuck to “Valid” and can be “Tripped”:
AND(

  EXISTS(AND($_undervoltage,EQ(Out, 'Valid'))),
  EXISTS(AND($_overvoltage, EQ(Out, 'Valid'))),
  EXISTS(EQ(Out, 'Tripped'))

)
The expressions of the effects in the template are displayed in Figure 11.
4.5. Safety analysis conclusions
The FMEA has been achieved using dedicated software that reads and applied the template. The analysis method relying on the template is not the topic of the presented work and its development is let free to the user. Therefore, the algorithm described in the following section is only presented for the sake of results reproducibility.
During the analysis, the software first detected the system components from the SPICE netlist and exhaustively listed all the failures mode to consider based on the desired failure mode source (IEC 61709 in the present case). From this list, a set of deviated models has been generated, each deviation corresponding to the failure mode interpretation (see Table 4) applied to the considered component. The list of system input combinations to test has then been established. In the current case, the system only has a single input (U3), hence this list contains the landmarks used for the abstraction of the U3 domain (see Figure 8).
In the second step, the software generated a set of models under failure, each model containing a deviation (0V, 1V, 2V, 3.32V, 3.34V, 6.65V, 6.67V, 8V, 9V, and 10V, see Figure 9). Each deviated model has then been simulated considering a constant input voltage U3 and the output (Out) numerical results has been associated to the corresponding qualitative value of its domain (see Table 3).
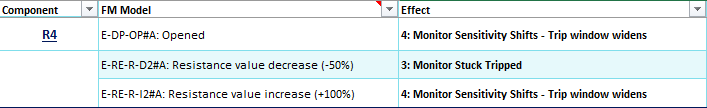
Eventually, a constraint-programing (MiniZinc) solver has been used to detect the occurrence of effects based on their formal expressions (see Figure 11) and the output qualitative results obtained for the different input and failure mode interpretations. Components are eventually listed in an Excel table with their considered failure modes and detected effects (see Figure 12).
The analysis has been achieved in approximately 15 minutes on a regular laptop (4 logical processors with 2.60 GHz frequency and a 5.9 Gigabit RAM). The results of both the ARP4761 and the generated FMEA closely matches for the effect we considered. The discrepancies in the FMEA results are due to:
- the safety analysis method: for instance, the effect “Monitor Stuck Tripped” was detected by the program instead of “Trip window tightens” when the R4 resistor value decreases. The reason for this imprecision is due to the selection of landmarks used for the evaluation of the system behavior. Using additional landmarks in the range of the qualitative “Valid” qualitative value (i.e. [3.34; 6.65] V) is needed to enable such an effect detection.
- mistakes in the results: for instance, the effect of “R4 Open” has been found to lead to a “Monitor Stuck Valid” in the ARP4761 (see Table 6) while it corresponds to a widening of the trip window as detected in our results (see Figure 12). In addition to this, it seems that the effect of R4 increase and decrease have been switched in the ARP4761.
- unclarities: for instance, it seems that a typo has been made in the ARP4761 for “R4 increase resistance” where the effect code 2 has been used in association with “Trip window tightens” but we expected code 4 instead.
As a remark, such mistakes and unclarities are typically what the use of safety templates and automated safety algorithms aims to avoid.
Table 6. FMEA results for the R4 resistor as presented in the ARP4761 [7]
| Component ID | Failure Mode | Failure (Code) Effect |
| R4 | Open | (1) Monitor stuck valid |
| R4 | Decrease resistance | (1) Trip window widens, may cause monitor stuck valid |
| R4 | Increase resistance | (2) Trip window tightens |
The system behavior has been tested by the automated safety analysis algorithm for selected landmarks. Although this allowed a quick evaluation of the FMEA by considering a reduced number of system inputs, it does not allow the detection of the tightening of the trip window. This issue could have been solved by adding additional landmarks (as we did with 1V, 2V, 8V, and 9V, see section 4.1). However, letting this problem happen allows us to highlight that the template alone is not sufficient to ensure the quality of FMEA results and are impacted by the sophistication of the safety analysis algorithm and/or human factors.
5. Conclusions & perspectives
In this paper, a template for the generation of FMEA has been proposed and successfully tested. The proposed template contains all the information needed to achieve a single point of failure FMEA: system behavior, failure mode descriptions, and effect definition. Using formal language for the expression of this information, the template can reduce the risk of errors in FMEA and serve as documentation of the analysis results. Moreover, as shown in the paper, using formalized language, the template can be read by a computer program and used to generate automated FMEA results.
The template structure and construction have been highlighted in the paper. An application relying on the template to generate an FMEA using an automated safety analysis algorithm allowed us to confirm that the proposed template contains all the needed formalized information for such an analysis. Indeed, the use of the template by an automated safety analysis algorithm allowed us to mainly recover the analysis conclusion provided in the ARP4761. Discrepancies existing between the analysis results are attributed to the safety algorithm and unclarities from the ARP4761.
One of the benefits of the template is its ability to be reused later with a more advanced safety automation program. We do believe that such a feature could be highly beneficial to companies by bringing the possibility to refine the safety analysis of their projects by simply re-running their automated safety program after an update. The practical demonstration of this is a perspective of this work.
In the present paper, the template has been used to generate FMEA, an extension of the template for performing more advanced safety analyses like FMEDA, FMECA or FTA is a perspective of this work.
Until now, the template has only proposed a structure for the organization of the data needed to achieve safety analysis where the formalization of the information was left free to the user. In future work, the determination and specification of a format for the data are aimed to ensure good durability and compatibility of the templates between themselves.
Would you like to download the conference paper? If so, you can find it here for your convenience-
https://ieeexplore.ieee.org/document/10115946
Comments, suggestions? Brickbats, bouquets? Please send your feedback to our editor.
Additional Resources
References
[1] P. Struss, “Automated Failure-modes-and-effects Analysis of Embedded Software Extended Abstract“, Pao, 2011.
[2] A. Fraracci, Model-based Failure-modes-and-effects Analysis and its Application to Aircraft Subsystems, 2008.
[3] P. Struss and A. Fraracci, “Modeling Hydraulic Components for Automated FMEA of a Braking System“, in Proceedings of the Annual Conference of the Prognostics and Health Management Society 2014, Fort, 2014.
[4] M. Esser and P. Struss, “Obtaining Models for Test Generation from Natural-language-like Functional Specifications“, in Fault Diagnosis of Civil Engineering Structures using the Bond Graph Approach, Nashville, 2007.
[5] F. Ortmeier, M. Güdemann and W. Reif, “Formal failure models“, 1st IFAC Workshop on Dependable Control of Discrete Systems (DCDS’07), 2007.
[6] M. Walker, Y. Papadopoulos, D. Parker, H. Lönn, M. Törngren, D. Chen, R. Johansson and A. Sandberg, “Semi-automatic FMEA supporting complex systems with combinations and sequences of failures“, SAE International Journal of Passenger Cars – Mechanical Systems, April 2009.
[7] SAE International, ARP4761 – Guidelines and Methods for Conducting the Safety Assessment Process on Civil Airborne Systems and Equipment is an Aerospace Recommended Practice, 1996.
[8] A. Bitner, F. Grigoleit and I. Valchev, Modelwise Paitron – A tool for automated FMEA, 2020.
[9] I. Wolforth, M. Walker, L. Grunske and Y. Papadopoulos, “Generalizable safety annotations for specification of failure patterns“, Journal of Software: Practice and Experience, Vol. 40, p. 453–483, March 2010.
[10] A. Rauzy, N. University, of Science and Technology, A Snapshot of AltaRica, 2020.
[11] M. Gudemann and F. Ortmeier, A Framework for Qualitative and Quantitative Formal Model-Based Safety Analysis, 2010.
[12] P. Struss, Automated Abstraction of Numerical Simulation Models – Theory and Practical Experience, 2002.
[13] F. Grigoleit, S. Holei, A. Pleuß, R. Reiser, J. Rhein, P. Struss and J. v. Wedel, “The qSafe Project Developing a Tool for Current Practice in Functional Safety Analysis“ Kalpa Publications in Computing, 2018.
[14] M. Walker and Y. Papadopoulos, “PANDORA 2: The time of priority-OR gates,“ IFAC Proceedings Volumes, Vol. 40, p. 25–30, 2007.
[15] Analog Devices, LTspice XVII (17.0.35.0), 2022.
Biography
Hadrien Tournaire (author page) received his master’s degree from Supméca, Saint-Ouen, France, in 2013. During his master, he focused on the modeling and simulation of mechatronic and complex systems. Dr. Hadrien Tournaire is a doctor from Paris-Saclay University who graduated in 2017 with his research on the reduction of finite element models of mechanical assemblies with large contacting interfaces. He is a modeling and simulation engineer at modelwise GmbH in Germany where he takes part in research on the automation of safety analysis. He formerly worked on safety calculation for nuclear structures and equipments using deterministic and probabilistic approaches
Florian Grigoleit is the CEO of Modelwise and a guest researcher at the Technical University of Munich in the Model-based Systems and Qualitative Research Group.
Jan Neumann-Mahlkau (author page) is an industrial engineer working at modelwise GmbH as a safety manager. He is responsible for functional safety and the implementation of pilot projects. During his master’s thesis, he worked on the automation of safety analysis through the safety assessment of an optical sensor system.
