The TLDR: Too busy to read? Here's a quick summary of article

Comparison of manual & automated FMEA: The article compares a manually generated expert Failure Modes and Effects Analysis (FMEA) taken from SAE ARP 4761, a guideline for the safety assessment of civil aircraft systems, with an automatically generated FMEA, produced with Paitron.

Voltage monitor system as a case study: The article focuses on the voltage monitoring function of a power supply system of a braking system control unit, and shows how Paitron can model and simulate the system and its failure modes.

Discrepancies between the two FMEAs: The article reveals that the manual FMEA from ARP 4761 contains errors and inconsistencies, while the automated FMEA from Paitron is more accurate and trustworthy.

Limitations and suggestions of ARP 4761: The article discusses the lack of guidance for addressing common mode failures and the limited scope of the guideline, and suggests a more proactive approach to safety assessment that involves considering potential hazards and risks throughout the entire system lifecycle, rather than just during development.
Introduction
This article aims to compare a manually generated expert Failure Modes and Effects Analysis (FMEA) with an automatically generated one produced with Paitron. The manual expert FMEA is taken from SAE ARP 4761 [1], a document that describes guidelines and methods for conducting a safety assessment for the certification of a civil aircraft. The report provides, among other analysis methods, a piece-part FMEA performed on the power supply monitor of the power supply system of a braking system control unit.
In the present publication, the numerical model of the voltage monitor has been built based on the electrical drawings and simulated using LTspice®, a SPICE simulation software provided by the Linear Technology Corporation (Analog Devices) [3].
Analysis setup
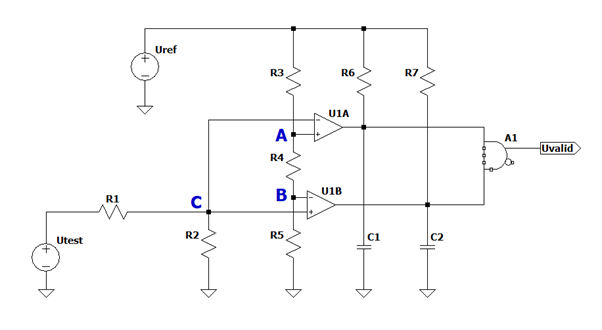
The preliminary study presented in this paper focuses on the voltage monitoring function provided by the device introduced in ARP 4761 [1]. The circuit-level implementation of this function is shown in Figure 1. The circuit is designed as a window comparator. The comparator ICs U1A and U1B compare the resistively divided tested voltage (Utest) against the reduced reference voltage (Uref) to detect over (U1B) and under (U1A) voltage conditions. The capacitors C1 and C2 implement first-order RC filters to effectively delay the circuit output in the presence of noise or ripple of the input signal. The comparators outputs are ANDed together so that if any voltage exceeds the trip point, high or low, the monitor output (Uvalid) is pulled low.
Within this project, an FMEA for the voltage monitor system was performed automatically with Paitron. To evaluate Paitron’s performance, these results are compared to a reference FMEA, which was taken from ARP 4761. The following table shows the system effects and their criticality, which are tracked.
Table 1: Voltage monitor studied effects
| System effect | Description | Criticality |
| Monitor stuck valid | The voltage monitor always produces a high (valid) output signal, regardless of the actual input voltage. | Dangerous |
| Monitor stuck tripped | The voltage monitor always produces a low (invalid) output signal. | Dangerous |
| Window shift | The thresholds for the validation of the input voltage both decrease or increase. | Dangerous |
| Trip window widens/tightens | The thresholds for the validation of the input voltage shift in the opposite direction, such that the monitoring function becomes less/more sensitive. | Dangerous |
Failure Modes and Effects Analysis (FMEA)
The FMEA was necessary to verify the design complies with the requirement of having less than 2E-7 failures per hour (200 Failures In Time (FIT)). The actual failure rate given by the standard is 1.42E-7 failures per hour, which matches the automatically generated 142 FIT.
With 12 components and considering the ARP 4761, the safety analysis of the voltage monitor system requires the study of 48 failure modes, among which Paitron:
- Analyzed 9 out of 12 components.
- Identified 36 possible failure modes of the system.
- Was able to propose a model of the system for 36 failure modes.
- Successfully evaluated the effects of 36 of the system’s failure modes, while 22 of them are leading to an effect. The rest is not leading to any system effect.
The analysis lasted less than 10 minutes and allowed to cover 75% of all failure modes to be considered for the entire analysis. Paitron in its version 1.7 has no integrated circuits such as the comparator ICs in its failure mode database yet. Those components will be added in future Paitron releases. With 75% automation, the manual work can still be drastically limited. The missing components, their failure modes, and the respective failure rates had to be set manually.
A view of the FMEA results generated by Paitron is given below. A detailed overview of the achieved metrics of the automated analysis is provided in Table 3. For the automated analysis, information about the failure modes and their distributions were taken from the IEC 61709 [4], while the components’ FIT rates were selected from the MIL-HDBK-217F standard [2]. The expert FMEA shown in ARP 4761 relied only on the MIL-HDBK-217F standard. The differences in the final metrics are due to the different Failure Mode Distributions (e.g., Safe Failure Fraction), while the FIT rates were reproduced (e.g., Safety Function Failure Rate).
Table 2: Safety analysis of the voltage monitor generated using Paitron
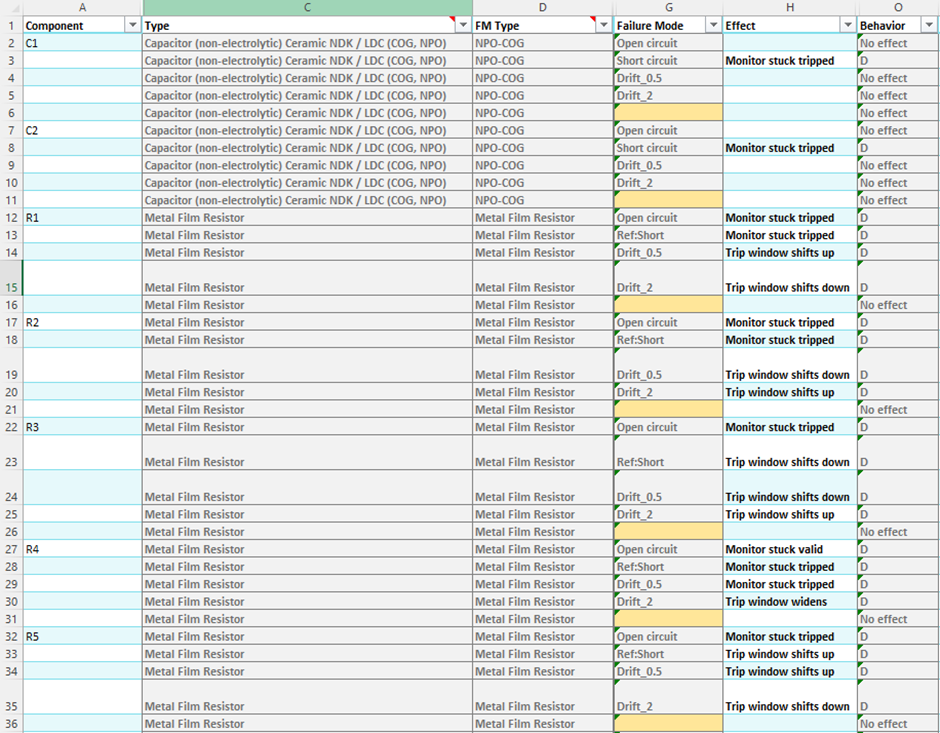
Table 3: Safety metrics of the voltage monitor evaluated using Paitron
| Metric | Results |
| Safe Failure Fraction (SFF) | 5,95% |
| Safety Function Failure Rate [1/h] | 142 FIT |
| Device Failure Rate [1/h] | 142 FIT |
| Mean Time Between Failure (MTBF) [h] | 803 years |
Comparison
The results of the two analyses were compared, and discrepancies were noticed. For the analysis, Paitron checked an additional failure mode for the capacitors and one for the resistors. For the capacitors, not only the Drift_0.5 (the capacitance drifts by -50%) was tested, but also the Drift_2 (the capacitance drifts by +100%) failure mode, while for the resistors, the Short Circuit failure mode was additionally tested by Paitron. The difference is documented in Table 4.
Table 4: Discrepancies between the failure modes of an expert FMEA and an automated FMEA
| Component | Reference FMEA (ARP 4761) | Paitron |
| Capacitor | Open | Open |
| Short | Short | |
| Low cap. (Drift_0.5) | Low cap. (Drift_0.5) | |
| – | High cap. (Drift_2) | |
| Resistor | Open | Open |
| – | Short | |
| Low cap. (Drift_0.5) | Low cap. (Drift_0.5) | |
| High cap. (Drift_2) | High cap. (Drift_2) |
More interesting are the different results. For the increased and decreased resistance of R4, the manual and the automated analyses show different results. The discrepancies regarding the analysis results are highlighted in Table 5.
Table 5: Discrepancies between an expert and an automated FMEA
| Id | Component | Failure Mode | Paitron FMEA | Reference FMEA (ARP 4761) |
| 1 | R4 | Decreased R | Monitor stuck tripped | Trip window widens |
| 2 | R4 | Increased R | Trip window widens | Trip window tightens |
The effective comparison window is defined by the parameterization of the resistors R1 through R5: The voltage at node C (see Figure 1):
![\[ U_{C}=U_{test} * \frac{R 2}{R 1+R 2} \]](https://modelwise.ai/wp-content/ql-cache/quicklatex.com-1c35345b91c813bac08ed544ffc52aca_l3.png "Rendered by QuickLaTeX.com")
The voltage (UA) at the positive input of the U1A comparator (node A) is expressed as:
![\[ U_{A}=U_{r e f} * \frac{R 4+R 5}{R 3+R 4+R 5} \]](https://modelwise.ai/wp-content/ql-cache/quicklatex.com-278dd6292ae15f4469f768b3824300d4_l3.png "Rendered by QuickLaTeX.com")
while voltage (UB) at the negative input of the U1B comparator (node B) is expressed as:
![\[ U_{B}=U_{r e f} * \frac{R 5}{R 3+R 4+R 5} \]](https://modelwise.ai/wp-content/ql-cache/quicklatex.com-62e64459567d1f96fa3af1b7dc0e3ffd_l3.png "Rendered by QuickLaTeX.com")
The overvoltage comparator U1B gives a valid (high) output as long as UB < UC holds and the under-voltage comparator U1A gives a valid (high) output as long as UA > UC holds. Accordingly, the tested voltage monitor provides a high output signal when the tested voltage Utest belongs to a voltage window [Umin; Umax] defined so that:
![\[ U_{min }=U_{r e f} * \frac{R 1+R 2}{R 2} * \frac{R 5}{R 3+R 4+R 5} \]](https://modelwise.ai/wp-content/ql-cache/quicklatex.com-75f39037bd5e0360d0d8b032e4f5000f_l3.png "Rendered by QuickLaTeX.com")
![\[ U_{max }=U_{r e f} * \frac{R 1+R 2}{R 2} * \frac{R 4+R 5}{R 3+R 4+R 5} \]](https://modelwise.ai/wp-content/ql-cache/quicklatex.com-2f3a397dd4aeb62343f9a685921bc1b3_l3.png "Rendered by QuickLaTeX.com")
For a decrease of R4, the effective comparison window [Umin; Umax] becomes narrower as Umin and Umax tend to the same value
![\[ U_{r e f} * \frac{R 1+R 2}{R 2} * \frac{R 5}{R 3+R 5} \]](https://modelwise.ai/wp-content/ql-cache/quicklatex.com-6571665fd74e5ebff0472b468e9cee9b_l3.png "Rendered by QuickLaTeX.com")
On the contrary, the larger R4 is, the wider the window [Umin; Umax] becomes since Umin tends to 0 while Umax tends to
![\[ U_{r e f } * \frac{R 1+R 2}{R 2} \]](https://modelwise.ai/wp-content/ql-cache/quicklatex.com-381f9f7b86ef76267a03578bc4ed1c1b_l3.png "Rendered by QuickLaTeX.com")
Hence, in extreme cases, the decreased resistance (e.g., short circuit) of R4 even leads to a monitor stuck tripped. On the other hand, an increased resistance (e.g., open circuit) of R4 would let the effective comparison widen instead of tightening.
Conclusion
The safety analysis in this article was performed to validate Paitron by comparing the automated analysis results with those from the ARP 4761. We noticed differences between the manual analysis carried out by industry experts and our automated approach. More precisely, the failure modes of one of the resistors were leading to different system effects. Those cases have been inspected by a safety expert from Modelwise and were also verified by modeling those specific failure modes. The model, as well as our safety expert, confirmed the automatically generated FMEDA.
As safety analyses are cumbersome and error-prone, human errors are not rare. With Paitron automating this task, such analyses become more accurate and trustworthy. Discovering an error in an expert FMEA raises the question: How many errors are there to be discovered?
Comments, suggestions? Brickbats, bouquets? Please send your feedback to our editor.
Additional Resources
References
[1] ARP 4761, Guidelines and Methods for Conducting the Safety Assessment Process on Civil Airborne Systems and Equipment, SAE International, 1996
[2] MIL-HDBK-217F, Reliability Prediction of Electronic Equipment, Department of Defense – United States of America, 1991
[3] “LTspice,” LTspice Simulator | Analog Devices. [Online]. Available: https://www.analog.com/en/design-center/design-tools-and-calculators/ltspice-simulator.html [accessed 25.11.2021]
[4] IEC 61709, Electric Components -Reliability -Reference Conditions for Failure Rates and Stress Models for Conversion, International Electrotechnical Commission, 2017
Project Toolkit
- Desktop PC: Intel Core I5-4690K 4*3.5Ghz, 8GB RAM, Windows 10 Enterprise
- Paitron v1.7 (v1.7.7982.40691)
- LTspice XVII (17.0.32.0)
